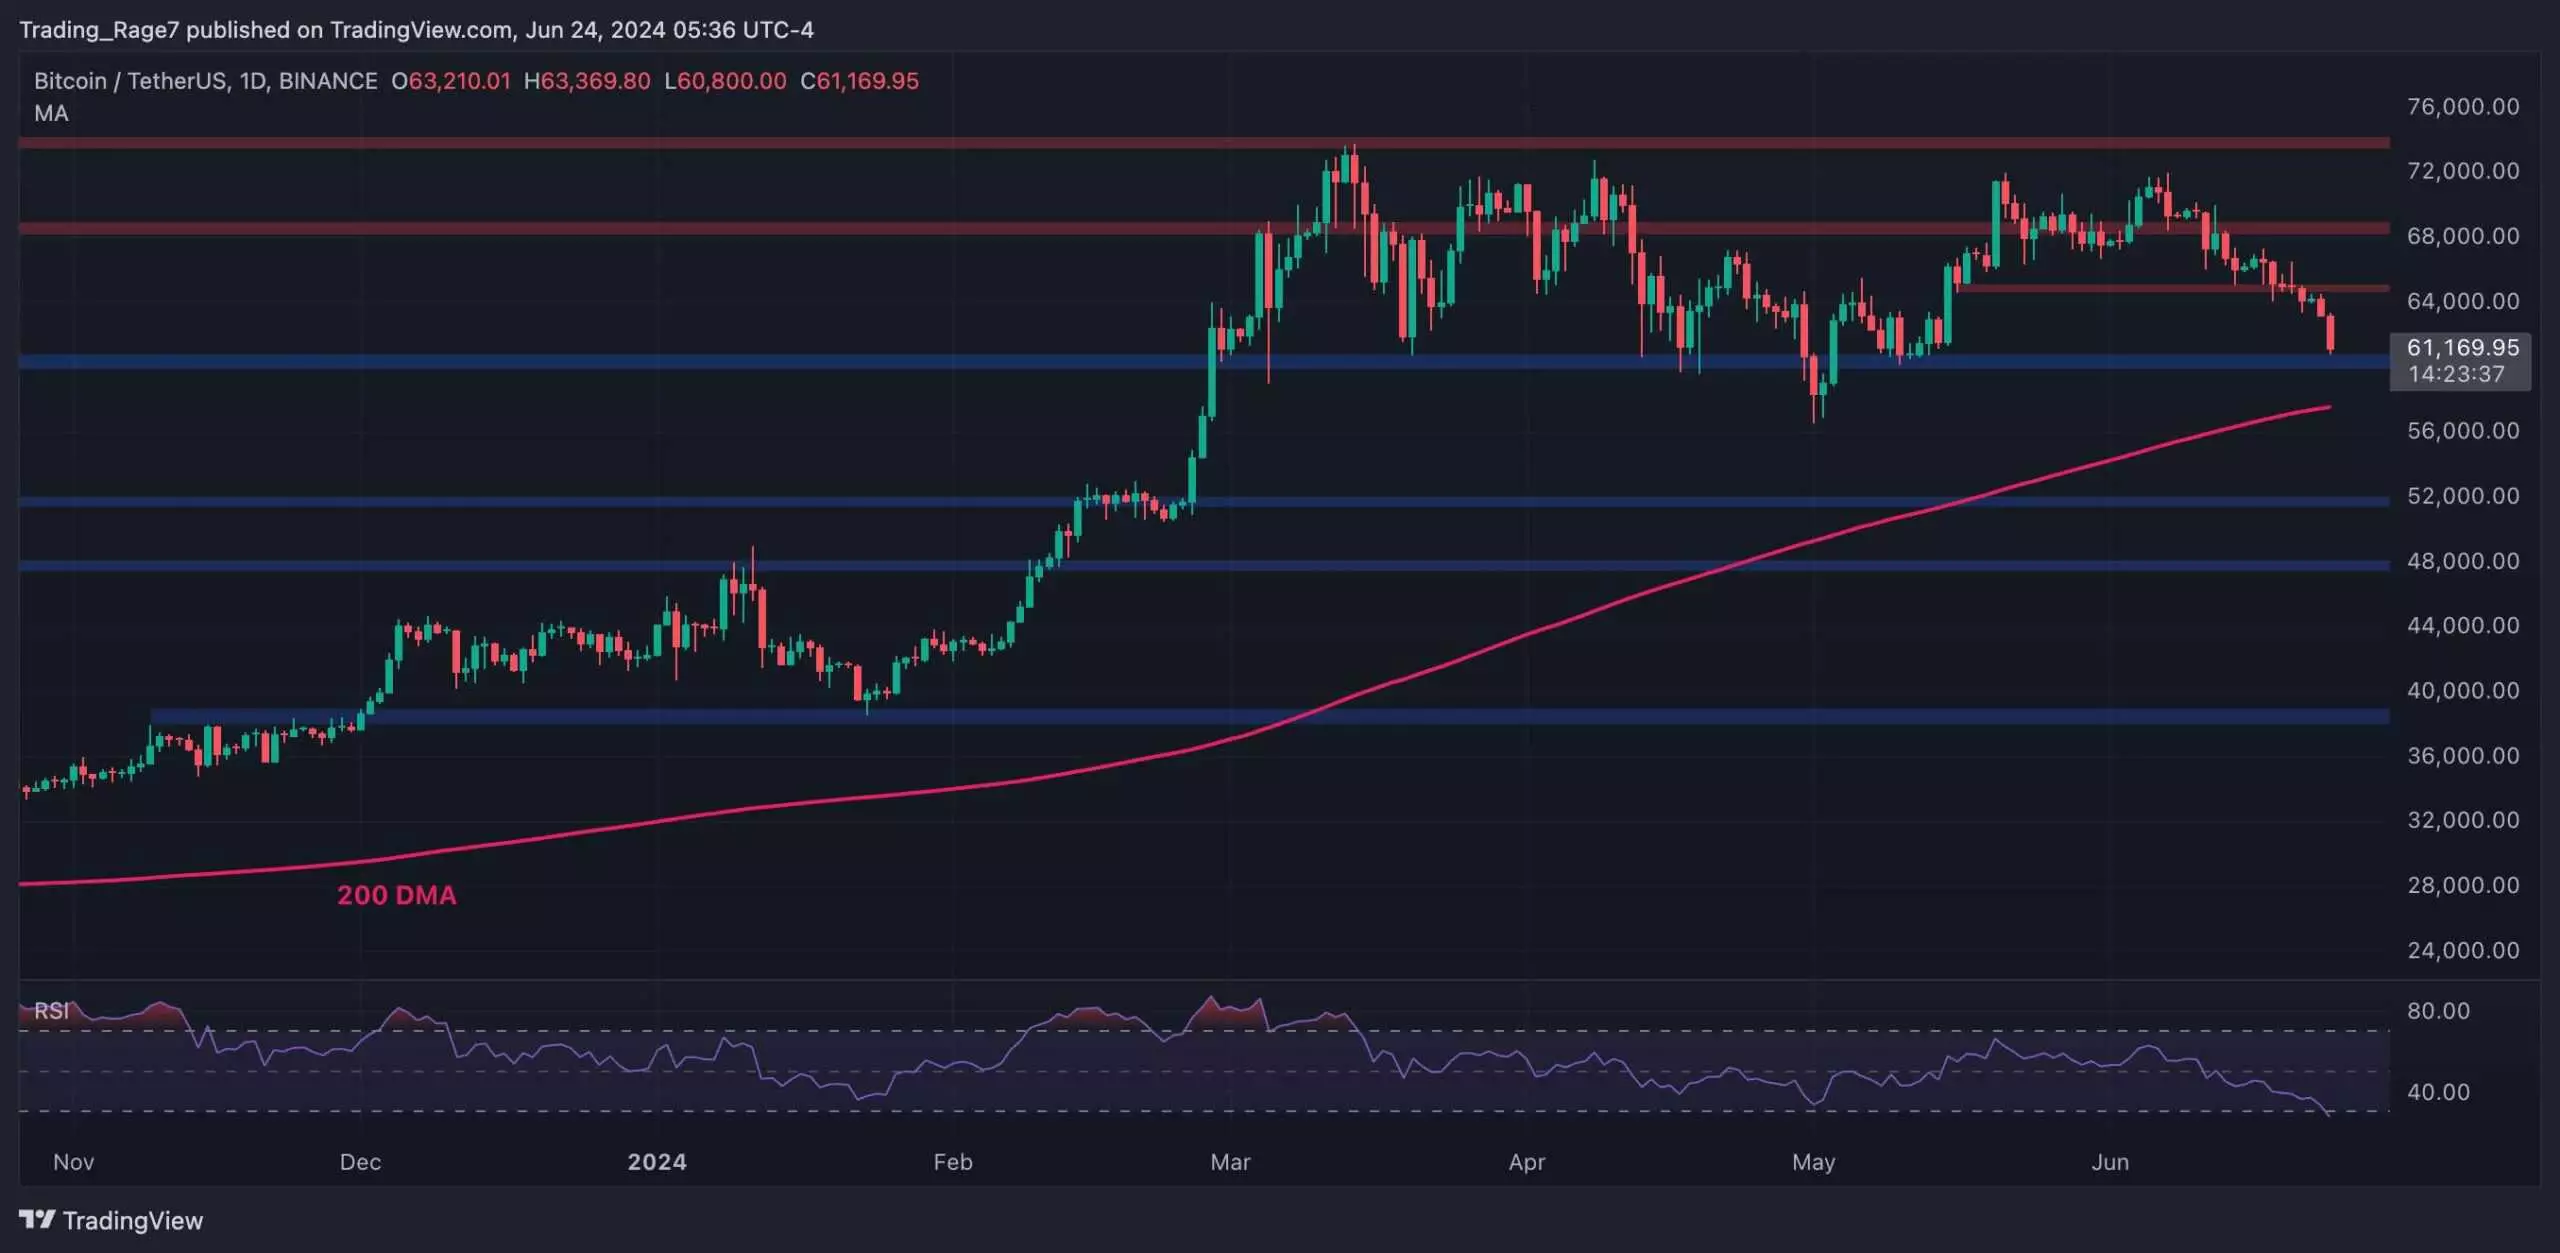
Bitcoin has experienced a significant price drop in recent days, falling from the $70K level and approaching a critical support level. The downward trend has been evident on the daily timeframe since the beginning of June, following a rejection from the $72K zone. As the price nears the pivotal $60K support level, there is speculation about a potential retest of the 200-day moving average at $58K if this level is breached.
On the 4-hour chart, a large falling wedge pattern has broken to the downside, signaling further bearish momentum. The Relative Strength Index (RSI) has declined rapidly, indicating that Bitcoin is currently oversold on this timeframe. A short-term rebound or consolidation is possible at the $60K support level, but a break below could lead to further downside towards the $58K support zone.
The recent price drop has impacted market participants differently, with some seeing their unrealized profits diminish while others have realized their gains and exited the market. The Bitcoin Short-Term Holder SOPR, which measures the profit and loss ratio of short-term holders, is trending downwards along with the BTC price. If the market drops below $60K, short-term holders could realize losses, signaling a potential shift in sentiment.
While the current market conditions may seem bearish, it is essential to consider the broader context of Bitcoin’s price movements. The uncertainty surrounding the market reaction to key support levels and technical indicators leaves room for both bullish and bearish scenarios. As investors navigate through this volatile period, it is crucial to stay informed and make decisions based on a comprehensive understanding of the market dynamics.

