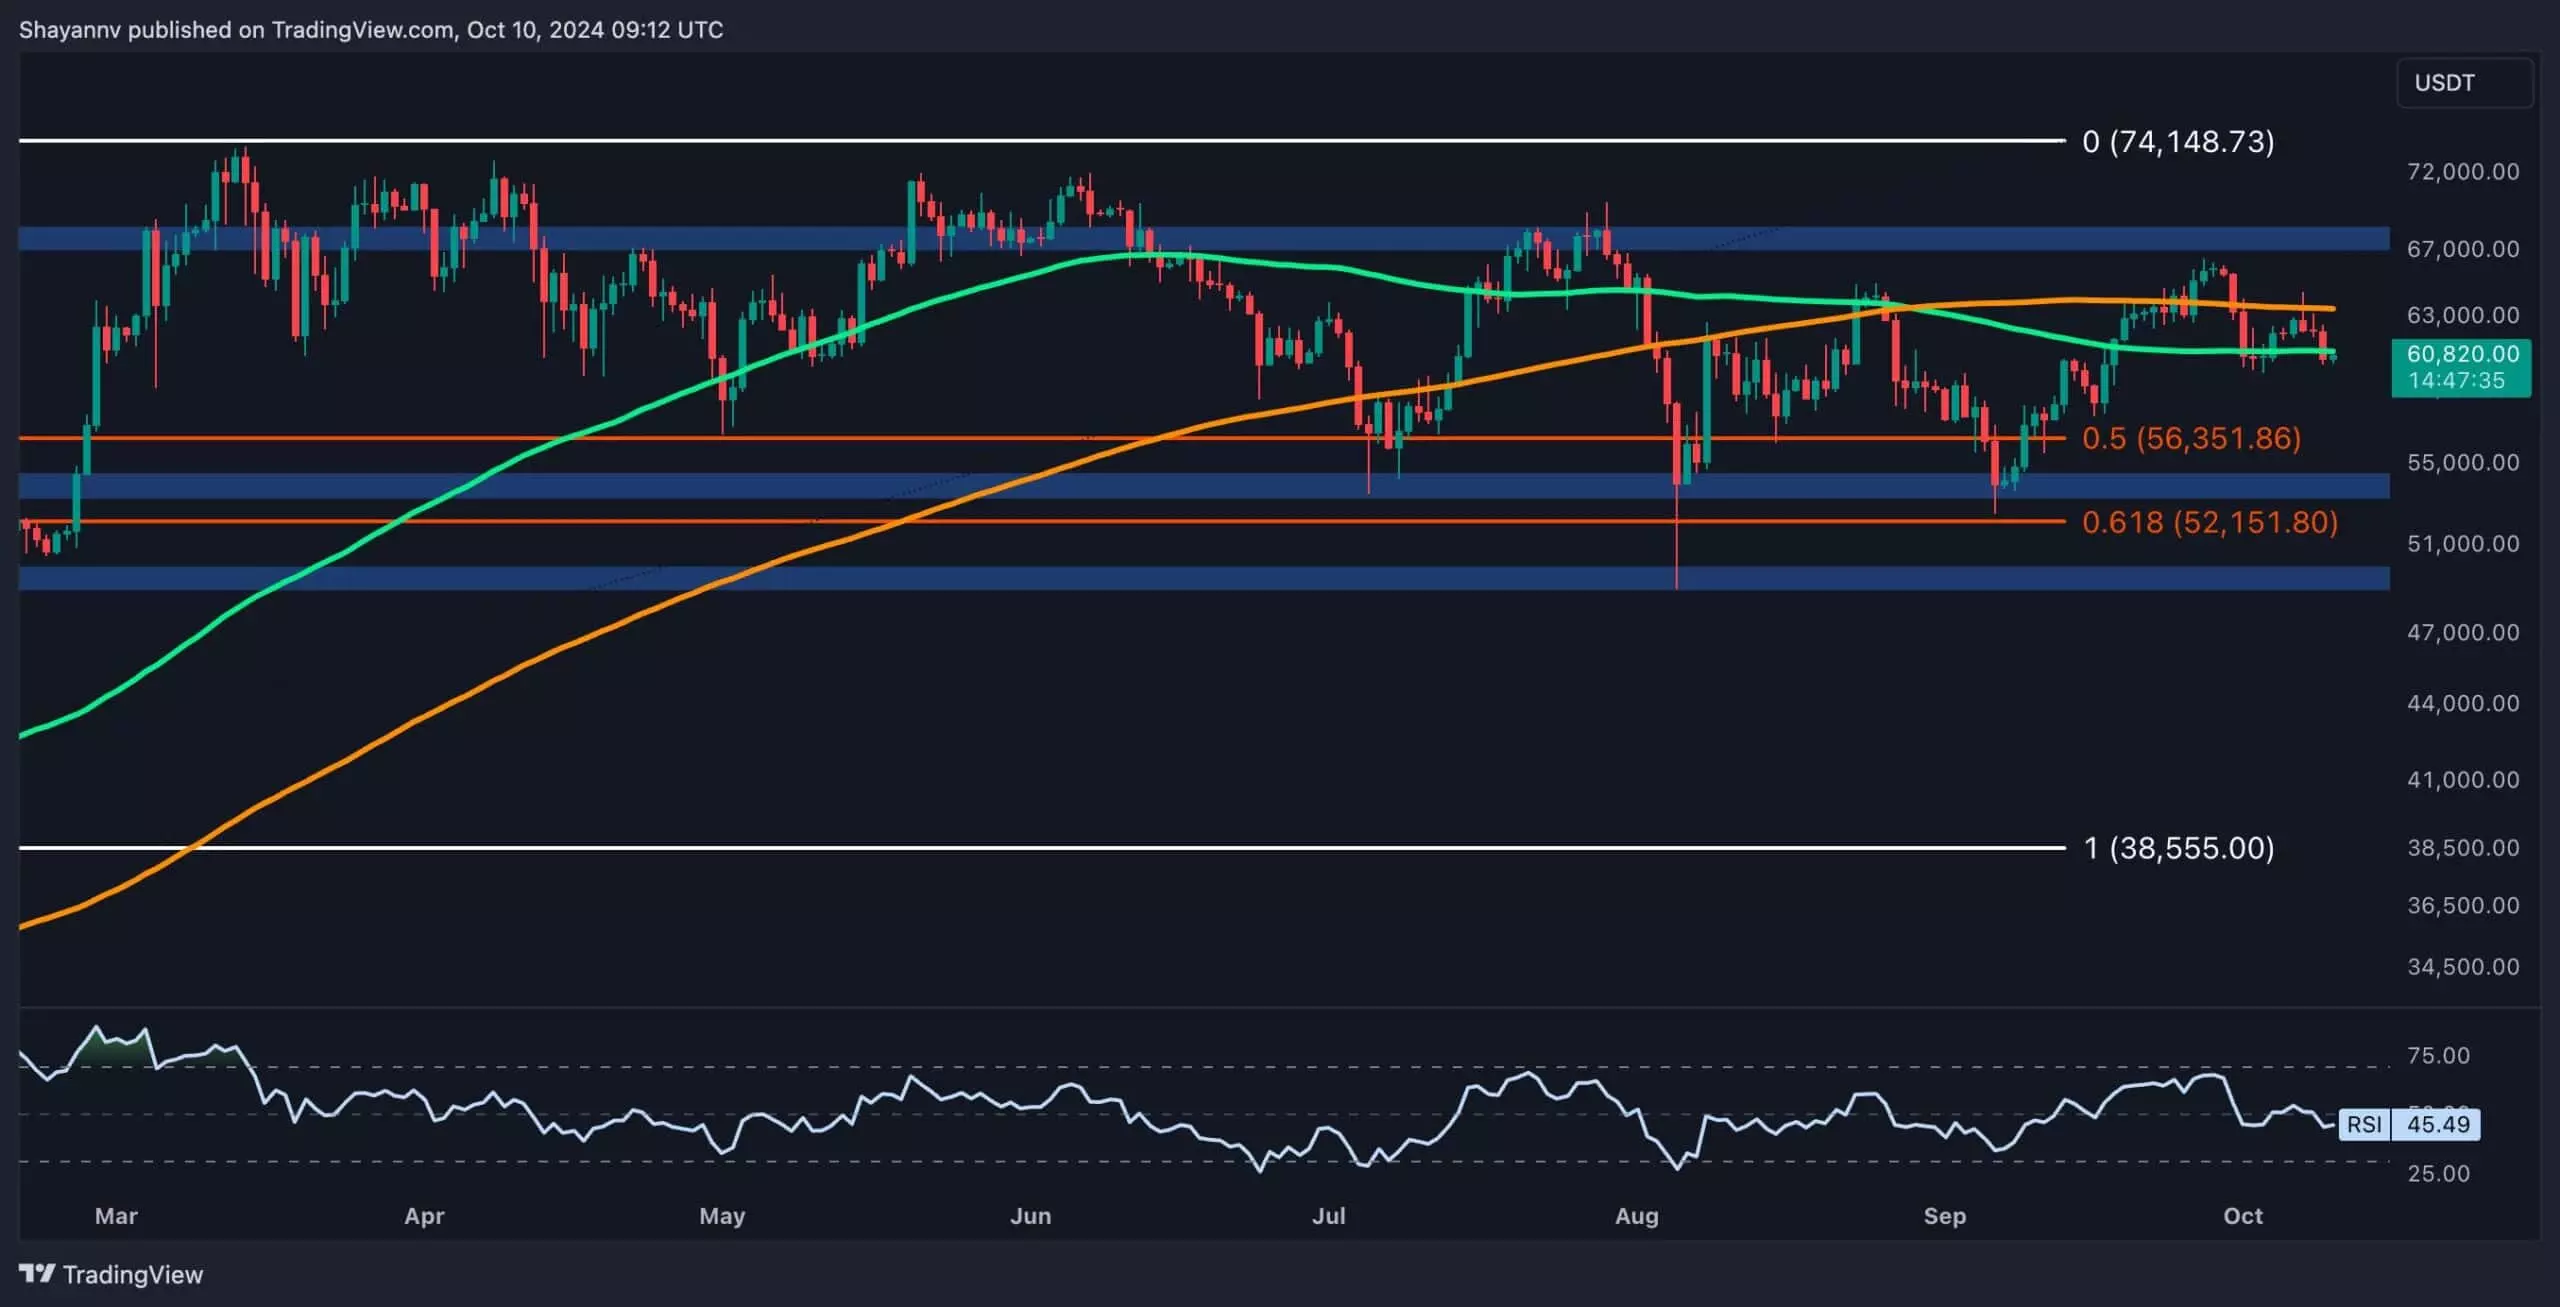
Bitcoin, the foremost cryptocurrency, has recently encountered significant resistance at the $66,000 mark, raising concerns over its future trajectory. With the price breaking below the vital 200-day moving average, the broader market sentiment appears to be tilting towards pessimism. This article dissects the recent developments related to Bitcoin’s price movements and market indicators to provide a nuanced understanding of the current landscape.
The cryptocurrency market is notoriously volatile, and Bitcoin is no exception. After a promising rally that saw it surpass both the 100-day and 200-day moving averages, expectations began to build around potential further gains. However, the upward movement was stymied at the $66,000 level, where significant selling pressure emerged, indicating that bulls had encountered formidable resistance. This rejection not only halted the bullish momentum but also signals a potential shift in sentiment among traders and investors.
The historical context of the $66,000 price point reveals that it has served as a multi-month resistance level. Therefore, Bitcoin’s failure to maintain its position above this threshold should not be overlooked; it suggests that the psychological barriers surrounding this price continue to exert influence. Currently trading around the $63,400 mark, the cryptocurrency is precariously perched above the 200-day moving average but is in danger of slipping below the key support level of $60,000. If this support is breached, a further decline towards the $52,000 to $55,000 range could be on the horizon.
The significance of moving averages in technical analysis cannot be understated. Bitcoin has proven to be sensitive to movements relative to both the 100-day and 200-day averages. The recent pullback raises questions about its ability to sustain price levels that were achieved during the previous bullish phase. Currently, Bitcoin’s proximity to these moving averages indicates a critical juncture; the 100-day moving average around $61,000 acts as another psychological marker that could dictate the next phase of price action.
In this context, the 4-hour chart allows traders to better visualise Bitcoin’s behavior in real-time. The currency, after reaching the Fibonacci retracement zone between 0.618 and 0.786, faced substantial resistance at the $66,000 price level. This area serves as a focal point for market participants, suggesting that unfulfilled demand led to a swift reversal, confirmed by a 10% price decline. As the asset enters a consolidation phase, maintaining the $60,000 support is critical; a decisive break below this level would mark a notable shift in market dynamics.
The Bitcoin Coinbase Premium Index provides essential insights into institutional investor behavior, with its current negative values reflecting bearish sentiment in the marketplace. The lack of demand from U.S. institutional investors can dampen bullish prospects significantly and lead to a protracted assessment period. For short-term traders, this environment is fraught with uncertainty as sell-offs or a pause in buying could unsettle positioning strategies.
Interestingly, periods of low sentiment, particularly among long-term holders, can often signal opportune moments for reinvestment. Market participants may find that this indecisive phase is conducive to scouting potential entry points, albeit with caution, as the risk of further declines remains high. As both accumulation and selling pressures appear to wane, the market is currently characterized by indecision, making it an inopportune time for aggressive short-term trading.
As Bitcoin navigates this tumultuous period, the balance of bullish and bearish sentiment remains precarious. The rejection at the $66,000 level has not only tested investor confidence but has also highlighted the importance of key price levels and moving averages in shaping future trends. Both institutional and retail investors must carefully observe the evolving patterns as the cryptocurrency market oscillates between accumulation and distribution.
In sum, Bitcoin faces critical support challenges while grappling with bearish market signals. Whether it can maintain its foothold above the $60,000 mark will determine the upcoming trend, and thus, continued vigilance is paramount for those invested in or monitoring this dynamic landscape.

