In the competitive landscape of cryptocurrencies, Cardano (ADA) has emerged as a notable contender, often mirroring the price movements of Bitcoin (BTC). This correlation has become particularly evident as both cryptocurrencies recently faced market corrections. Understanding Cardano’s price action through various technical indicators provides insights into its current standing and potential future movements.
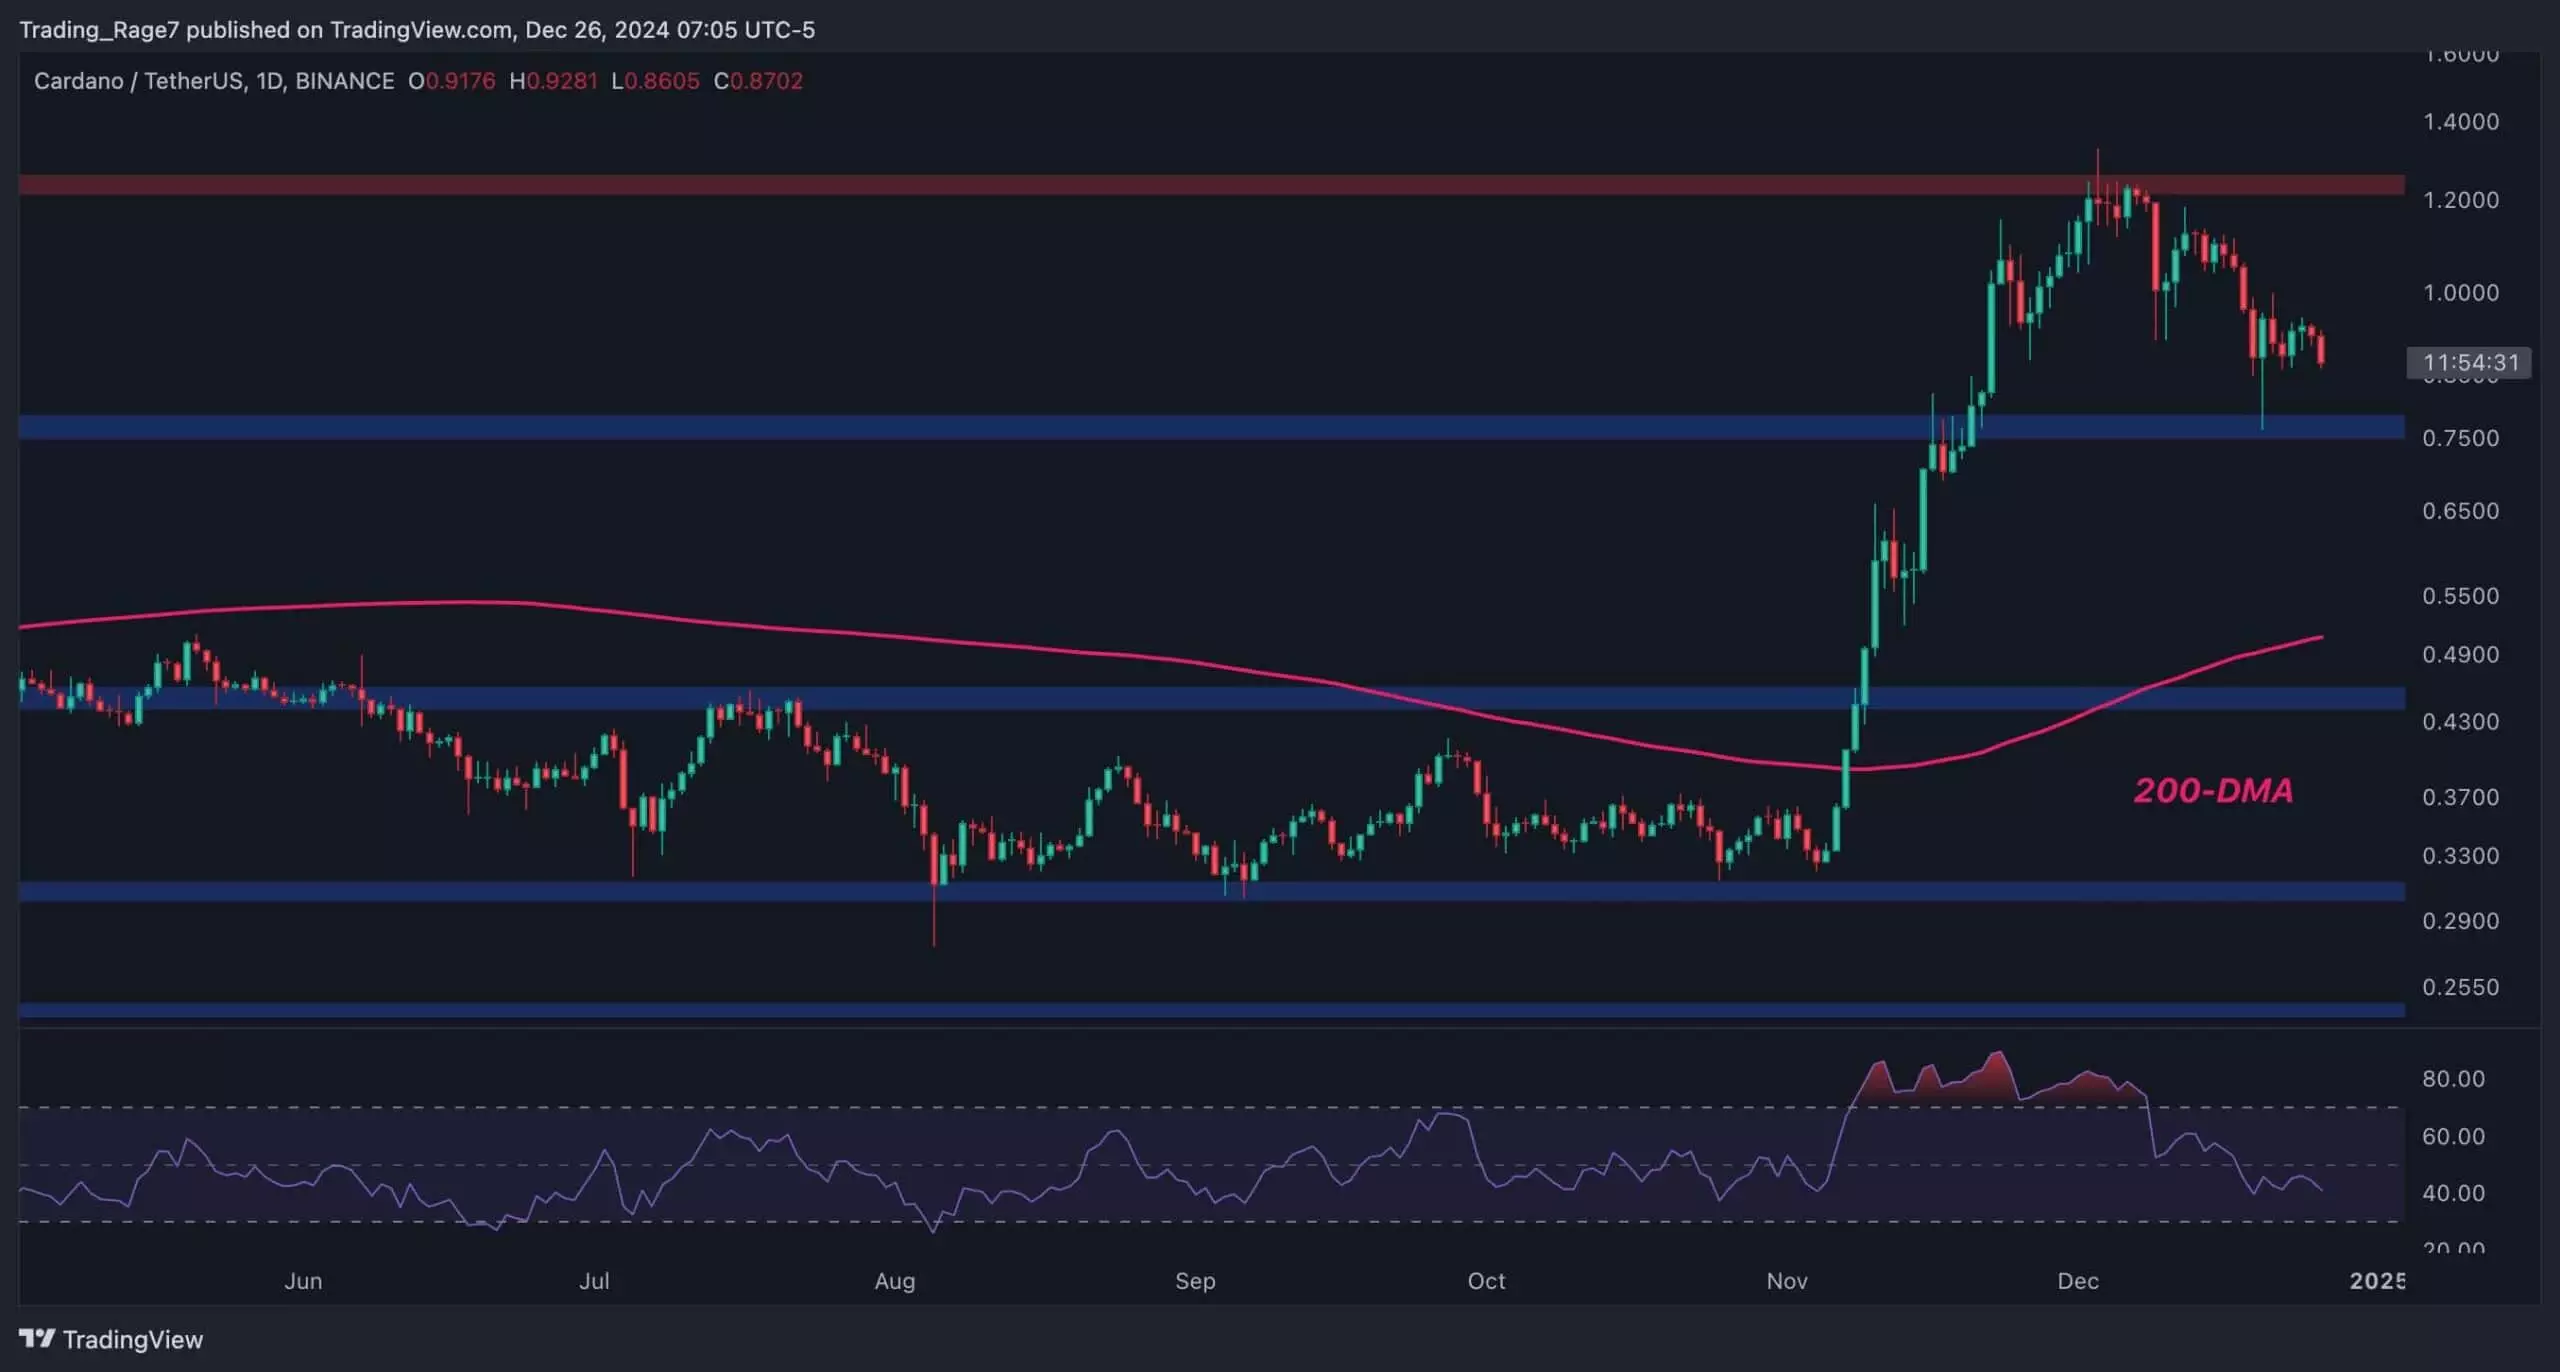
At the outset of November, Cardano initiated a significant price rally, breaking through crucial technical barriers, including the 200-day moving average. This upward momentum marked a time of optimism among investors, with ADA managing to breach several resistance levels. However, the $1.2 threshold proved to be a formidable barrier, as the asset faced repeated rejections at this price point. The persistent inability to maintain a position above $1.2 raises concerns about the sustainability of its recent gains and hints at underlying market weaknesses.
As Cardano’s price oscillates, it has gravitated towards the $0.75 support zone, which has served as a critical line of defense against deeper declines. This support level’s significance cannot be overstated; should it hold firm, it may facilitate a recovery, potentially paving the way for ADA to retest the $1.2 mark. Conversely, a breakdown below this level could lead the cryptocurrency toward the 200-day moving average, which is currently positioned around the $0.5 mark. Such a downturn would mirror a broader bearish trend, compelling traders to exercise caution in their investments.
Evaluating Cardano’s performance in relation to Bitcoin reveals a nuanced picture. Recent trends indicate that although ADA has briefly outperformed BTC during bullish phases, it faces headwinds when analyzed over a broader timeframe. The ADA/BTC trading pair is approaching a critical juncture as it flirts with the 1,000 SAT support level. A breach below this threshold could exacerbate the decline, steering prices towards the 200-day moving average situated around 700 SAT. This shift underscores a prevailing trend where traders might favor Bitcoin over Cardano, at least in the short term.
The unfolding situation surrounding Cardano necessitates a strategic approach for traders and investors. While a rebound above the $0.75 support zone could reignite bullish sentiment, the technical chart patterns suggest an imminent risk of further declines, particularly if the $1.2 resistance remains unchallenged. Consequently, the cryptocurrency market’s landscape is marked by volatility, with ADA potentially lagging behind Bitcoin in performance in the upcoming weeks.
Investors should stay vigilant and closely monitor these support and resistance levels, preparing to adapt their strategies based on real-time market movements.

