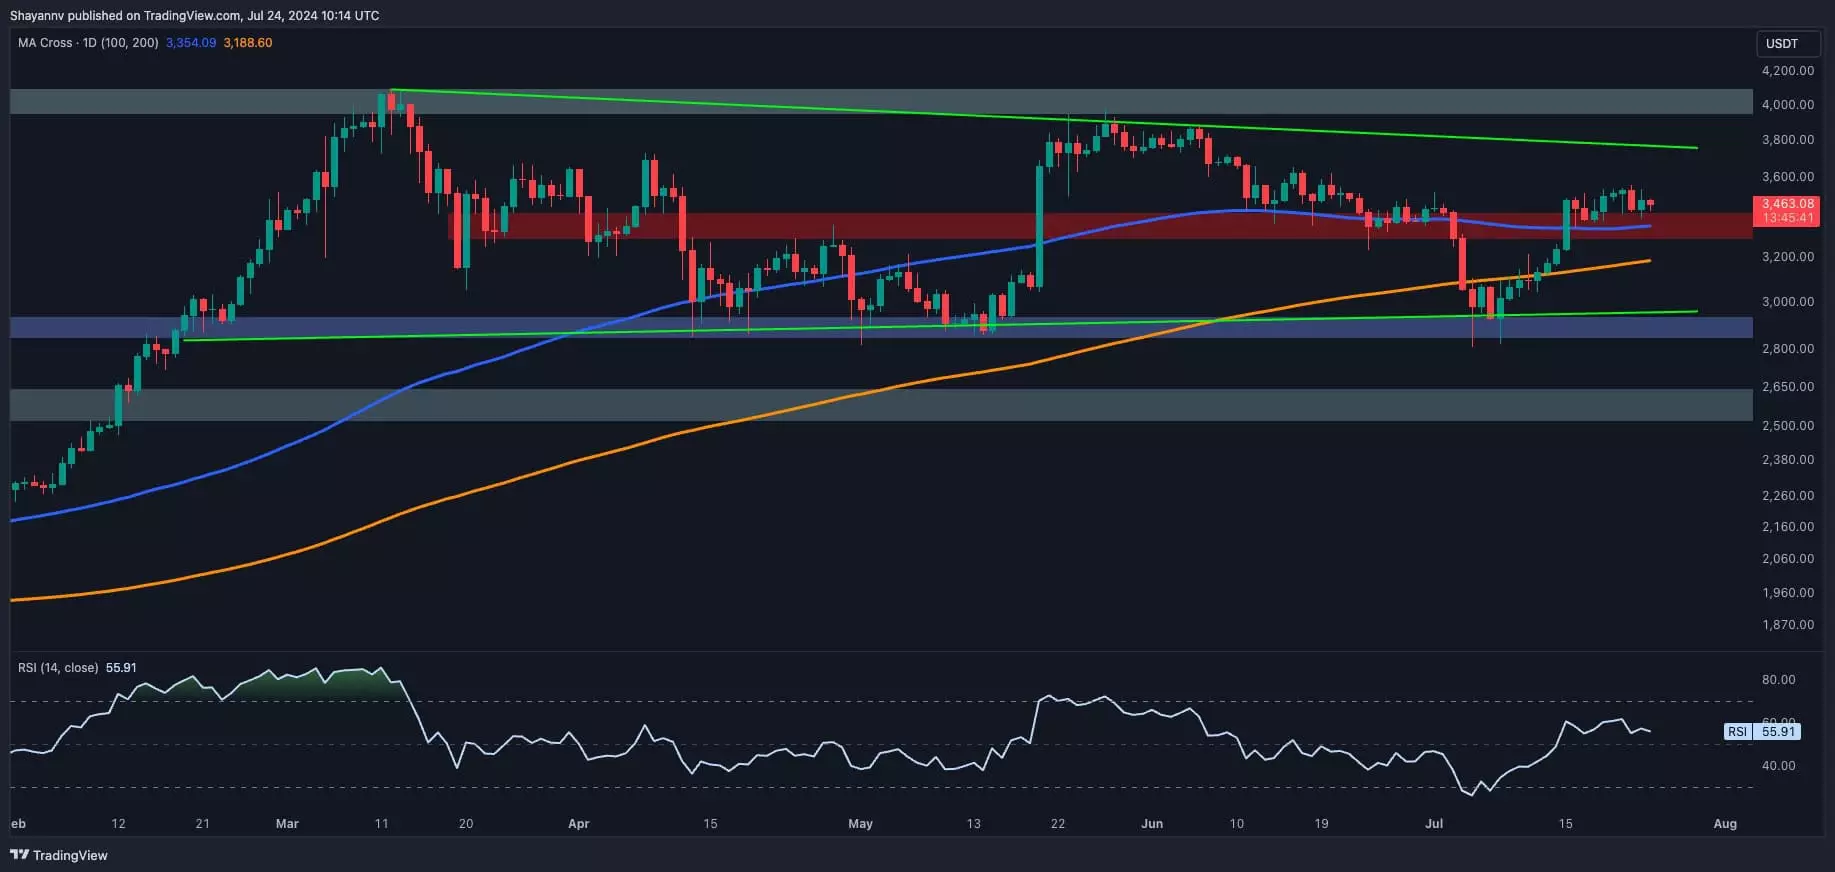
The recent price action of Ethereum has been consolidating above the 100 and 200-day moving averages, indicating a bullish trend in the market. After breaking above the critical 100-day moving average at $3,354, Ethereum entered a phase of sideways fluctuation, lacking clear direction. This period confirms the breakout and suggests an equilibrium between buyers and sellers. However, with the official launch of spot ETH ETFs and a net inflow of $106.6 million on their first day, an increase in buying interest is expected. This could pave the way for a continuation of the bullish rally, with the primary target for buyers being the wedge’s upper boundary at $3.7K. The price is currently confined within a crucial range, bound by the wedge’s upper boundary and significant support at $3.4K. A bullish breakout seems more likely in the mid-term.
Ethereum’s On-Chain Metrics Analysis
Analyzing the behavior of investors in the Ethereum market using on-chain metrics can provide valuable insights into the recent price recovery and future trends. The Ethereum Exchange Reserve metric, which measures the amount of ETH held in exchange wallets, is a key indicator to watch. A decrease in exchange reserves suggests accumulation by holders, while an increase usually indicates selling pressure. Recent data shows a rapid decrease in the exchange reserve metric, particularly following the news of Spot ETFs launching in July. This trend implies that many large investors have utilized the market correction to buy the dip and are now withdrawing their coins from exchanges. This reduction in available supply, combined with increasing buying interest from ETH ETFs, sets the stage for a potentially sustainable rally in the coming months.
Short-Term Price Analysis
On the 4-hour chart, Ethereum buyers have faced resistance in breaching the previous major swing high of $3.5K due to selling pressure. This has led to a period of sideways consolidation, with the price forming an ascending wedge pattern. While this pattern typically suggests a bearish reversal, the bullish sentiment in the market may lead to a break above the wedge. In the event of an unexpected bearish breakout, the price could experience a short-term retracement phase before continuing its bullish move. This scenario might present an opportunity for participants to accumulate ETH at lower prices. Overall, the short-term price action remains uncertain, with key levels of resistance and support determining the next major market move.
Ethereum’s price analysis reveals a bullish trend supported by the launch of spot ETH ETFs and decreasing exchange reserves indicating long-term holding intentions. While short-term price fluctuations may occur, the overall sentiment remains positive for a potential sustained rally in the coming months. Investors should closely monitor key levels and events to capitalize on potential opportunities in the evolving Ethereum market.

