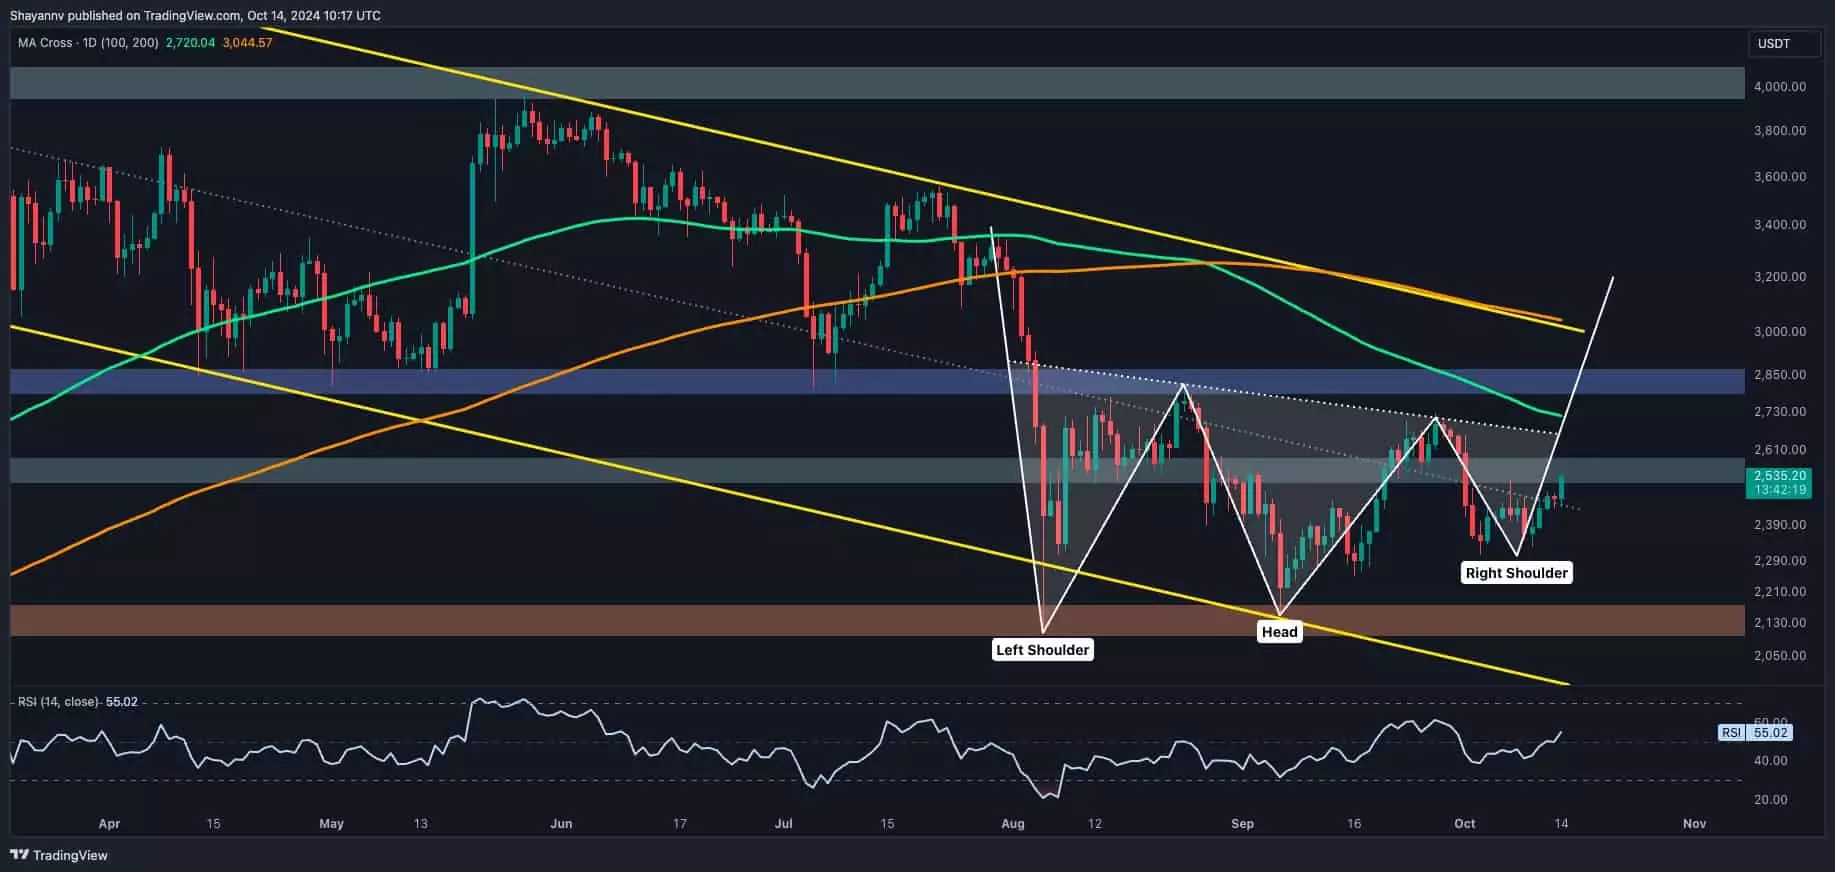
Ethereum, the second-largest cryptocurrency by market capitalization, is currently navigating through a pivotal phase characterized by complex technical patterns on its charts. Recent price action suggests that Ethereum is attempting to find a direction after a period of consolidation. The formation of an inverted head and shoulders pattern on the daily chart and a double-bottom pattern on the 4-hour chart are particularly noteworthy. These patterns signal a potential bullish reversal, which investors and traders alike are keenly monitoring as they form near significant support and resistance levels.
At the heart of this analysis is the $2.1K support level, where Ethereum appears to be establishing a firm base. This price point has been tested repeatedly, indicating strong buying interest in the market. As an important psychological threshold, the $2.1K level becomes a battleground for bulls and bears. Should Ethereum manage to break above the $2.7K neckline of the inverted head and shoulders pattern, it could ignite a rally that pushes the price towards the psychologically important $3K mark. Investors are advised to watch these crucial price levels closely, as they will play a significant role in determining the market’s future trajectory.
The Importance of Key Support and Resistance Levels
The narrative surrounding Ethereum is further complicated by its recent price movements, which are oscillating within a defined range between $2.1K and $2.7K. A closer examination reveals that alongside the primary support at $2.1K, the price has shown resilience around the $2.5K mark, effectively reclaiming the midpoint of a broader multi-month trading channel. This reclamation could be indicative of shifting sentiments among market participants, as buyers step in to provide support.
In terms of resistance, the $2.7K level holds significant importance not just technically, but psychologically as well. A closure above this neckline would signify substantial bullish momentum and could attract additional buying interest, potentially leading to a sharp price surge. Conversely, if Ethereum were to falter and dip below the crucial $2.1K support, it could trigger panic among investors and accelerate selling pressure, exposing the cryptocurrency to even lower price levels.
Examining market indicators, the ascending flag pattern on the 4-hour chart complicates the narrative further. Sellers have found it increasingly difficult to push prices below the lower boundary of this pattern, which is situated around the $2.3K level. As this support is tested, Ethereum’s market remains in a state of suspense, with the potential for a rapid price movement in either direction. Furthermore, a breakdown below this support could incite a long-squeeze, wherein leveraged positions are forcefully liquidated, significantly adding downward pressure to the price.
Additionally, the presence of the Fibonacci retracement levels provides further insight into recent price behavior. The 0.5 Fibonacci level, pegged at $2.6K, and the 0.618 level at $2.8K have emerged as essential zones of resistance that Ethereum must overcome to confirm any upward momentum. The interplay between these Fibonacci levels and the aforementioned patterns will likely dictate Ethereum’s price action in the near future.
Crucially, Ethereum is also being influenced by underlying liquidity dynamics in the market. Analyzing liquidity heatmaps from exchanges, we see concentrations of stop-loss orders and liquidation points predominantly around the $2.8K and $2K levels. For larger market players, including institutional traders and whales, these levels are critical as they represent zones of significant liquidity. The implications of these liquidity levels cannot be overlooked; a breakout above resistance or a breakdown below support could trigger cascading liquidations, causing drastic price movements.
As Ethereum continues to consolidate with decreasing volatility, the balance of power between buyers and sellers stands in a fine equilibrium. The upcoming days and weeks will be crucial as the price action nears critical support and resistance levels. An upward breakout could attract renewed bullish momentum while a breakdown could initiate a bearish cascade. Thus, investors must remain vigilant and adapt to the evolving market conditions as Ethereum seeks to establish its next trend.

