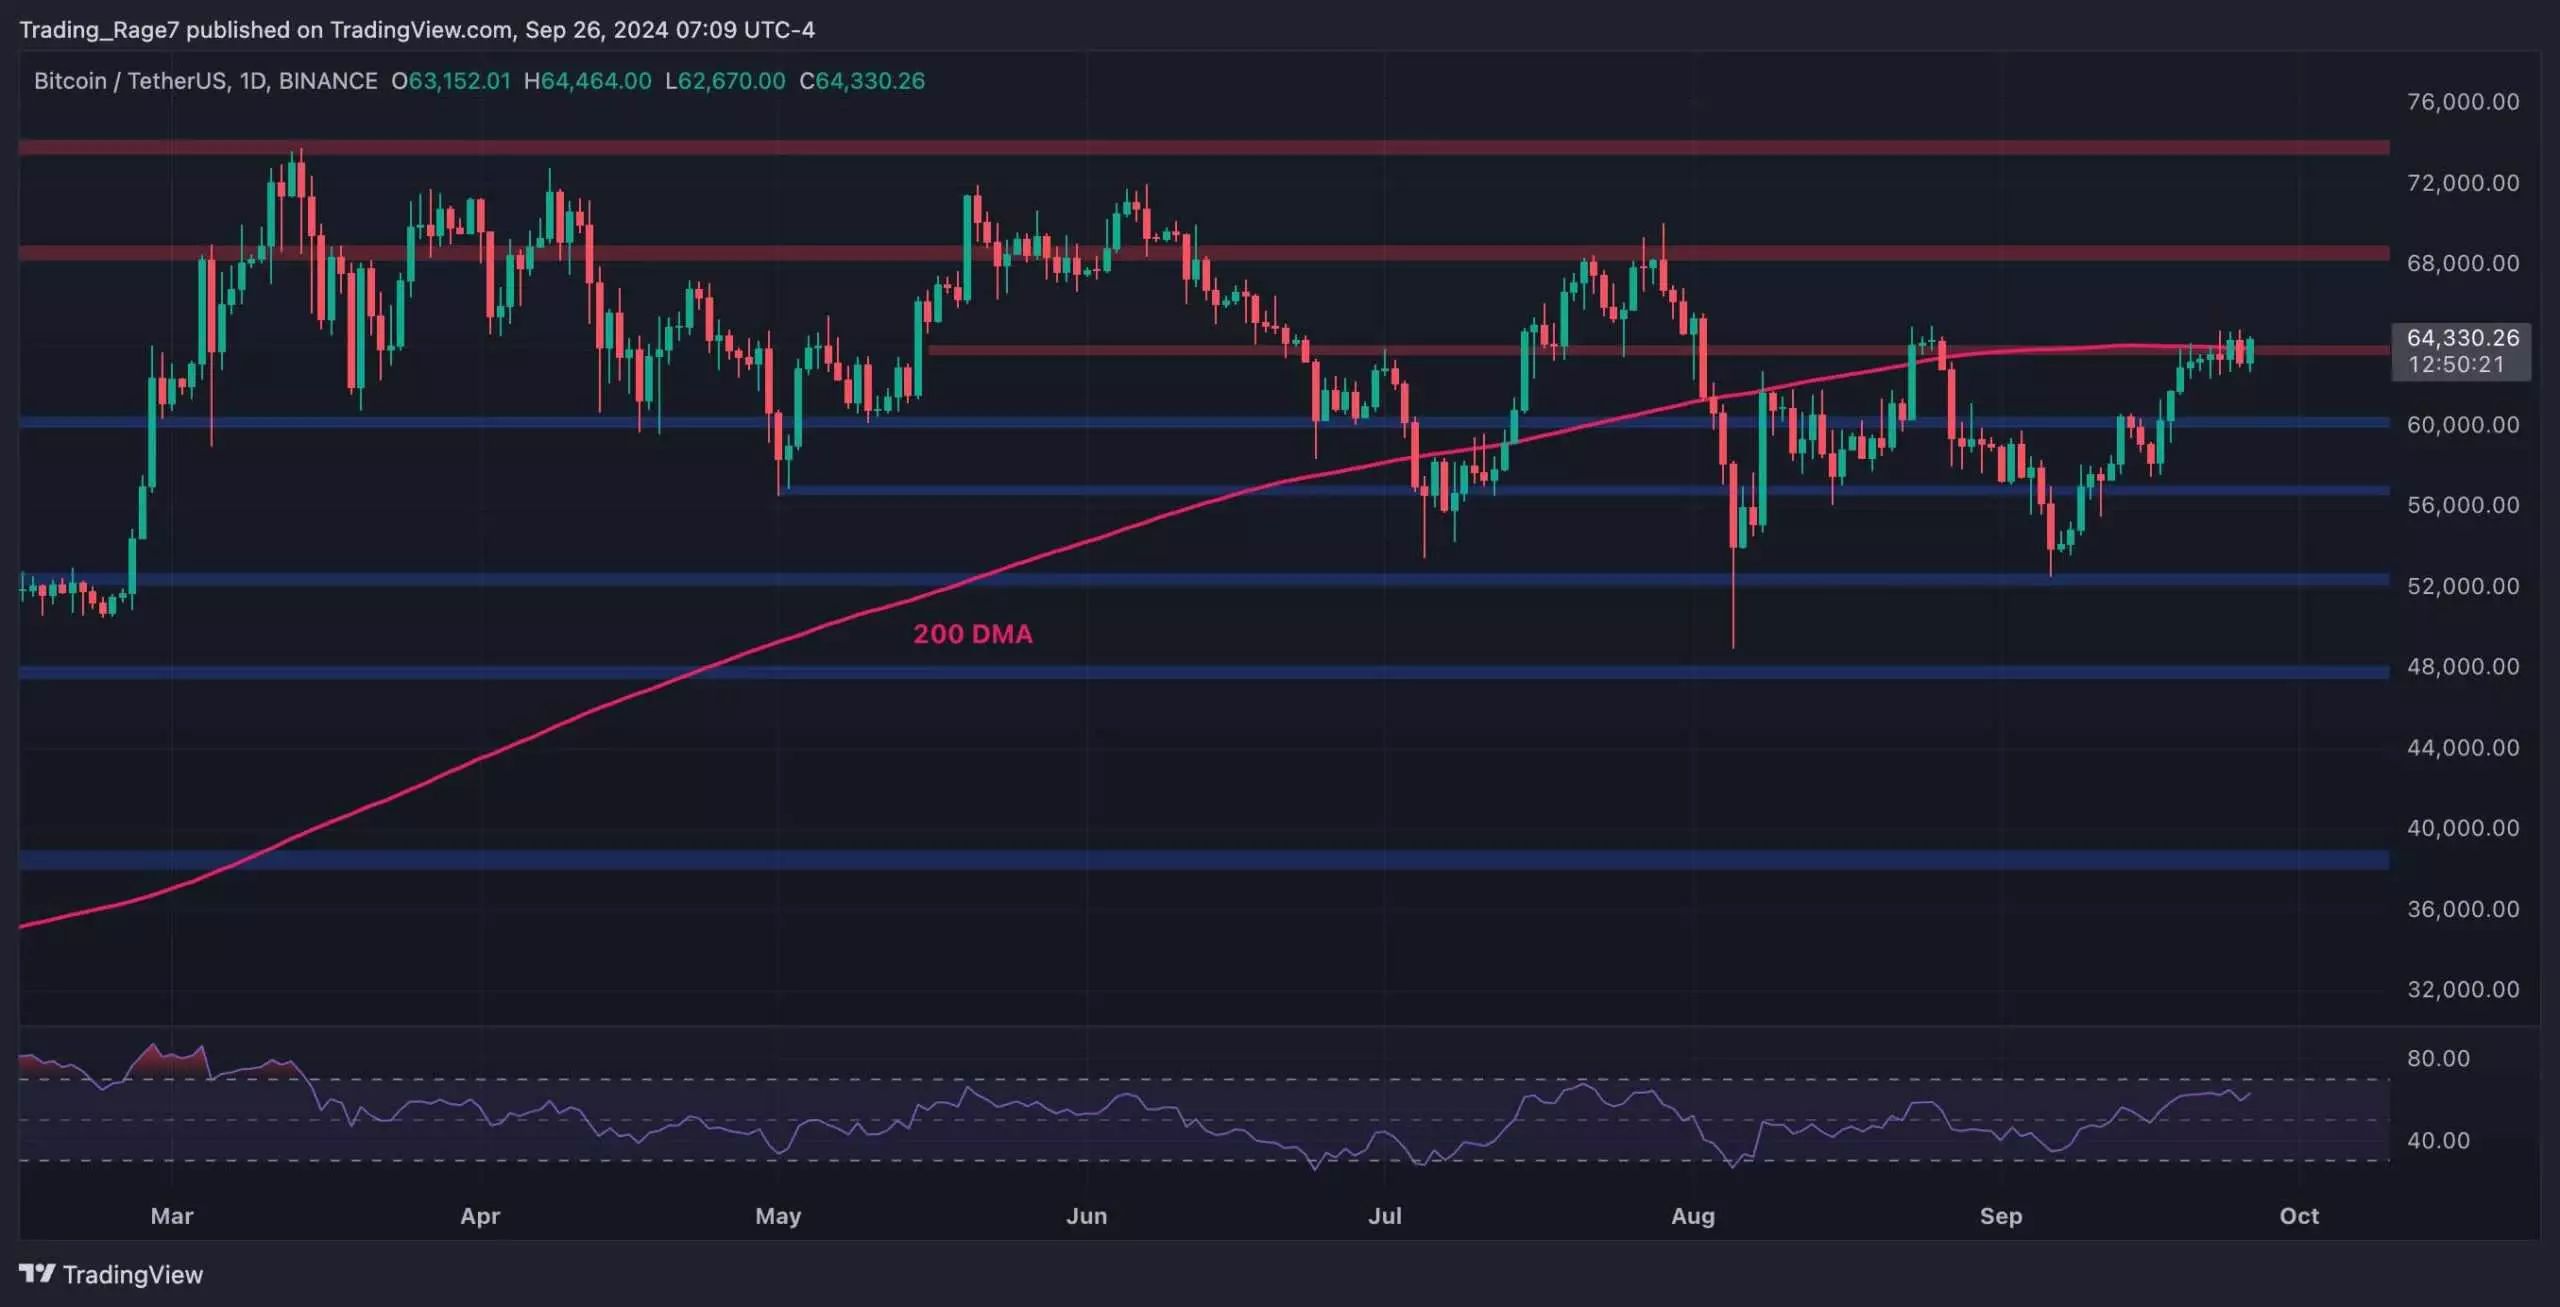
Bitcoin’s journey through the market has been nothing short of tumultuous, but as it approaches a significant price threshold, it’s imperative to analyze the potential ramifications for the broader cryptocurrency landscape. With current valuations hovering around the pivotal $64,000 mark, these levels of support and resistance will largely dictate Bitcoin’s next moves, which could have far-reaching consequences for both short and long-term investors.
Following a rebound from the strong support base at $52,000, Bitcoin has notably surged, breaking through prior resistance levels of both $56,000 and $60,000. This upward trajectory has signaled a promising phase for many traders; however, the asset now finds itself at a critical junction—the formidable 200-day moving average coincides with the $64,000 resistance level. Traders are eagerly watching for signs of a breakout, as a decisive move above this point could ignite a bullish rally, propelling prices toward new heights. Conversely, a rejection at this level may trigger a retreat, putting the $60,000 support under examination once again.
Zooming in on the 4-hour chart reveals the intricacies of Bitcoin’s current price action. The coin is presently consolidating within a small descending channel, making the situation particularly precarious. If Bitcoin breaks below this channel, it could indicate a classical bearish reversal and signal a potential downturn. Alternatively, a breakout to the upside would invalidate the bearish pattern and could set the stage for a rapid ascension towards the $70,000 range. The Relative Strength Index (RSI), hovering above 50%, currently leans in favor of a continuation of bullish momentum, but the overall market sentiment remains fragile.
The recent corrections in Bitcoin’s price have led to significant behavioral shifts among short-term holders. Amidst uncertainty, many have opted to liquidate their positions—often at a loss—accelerating the decline in the Bitcoin Short-Term Holder SOPR (Spent Output Profit Ratio). This indicator has plummeted since the previous all-time highs around $70,000, where short-term investors realized substantial profits. The trend observed, with SOPR dipping below one, underscores a potential panic-driven selling spree, raising alarm bells for those observing market dynamics.
What becomes critical now is how this cycle of profit-taking will influence market longevity. With many short-term holders shifting from panic selling to realizing gains as prices recover, the sustainability of this upward trend hinges on the balance between selling pressure and buyer demand. If the influx of cash from profit-taking overwhelms the market and is not countered by eager buyers, the potential for a downward spiral is significant.
As Bitcoin navigates through its current critical levels, traders and institutional investors alike would be wise to remain vigilant. In an ecosystem characterized by volatility, the next few trading sessions will provide deeper insights into whether Bitcoin can maintain its momentum or if a bearish reversal is on the horizon. Understanding these dynamics is integral for anyone looking to engage with the cryptocurrency markets in a meaningful way.

