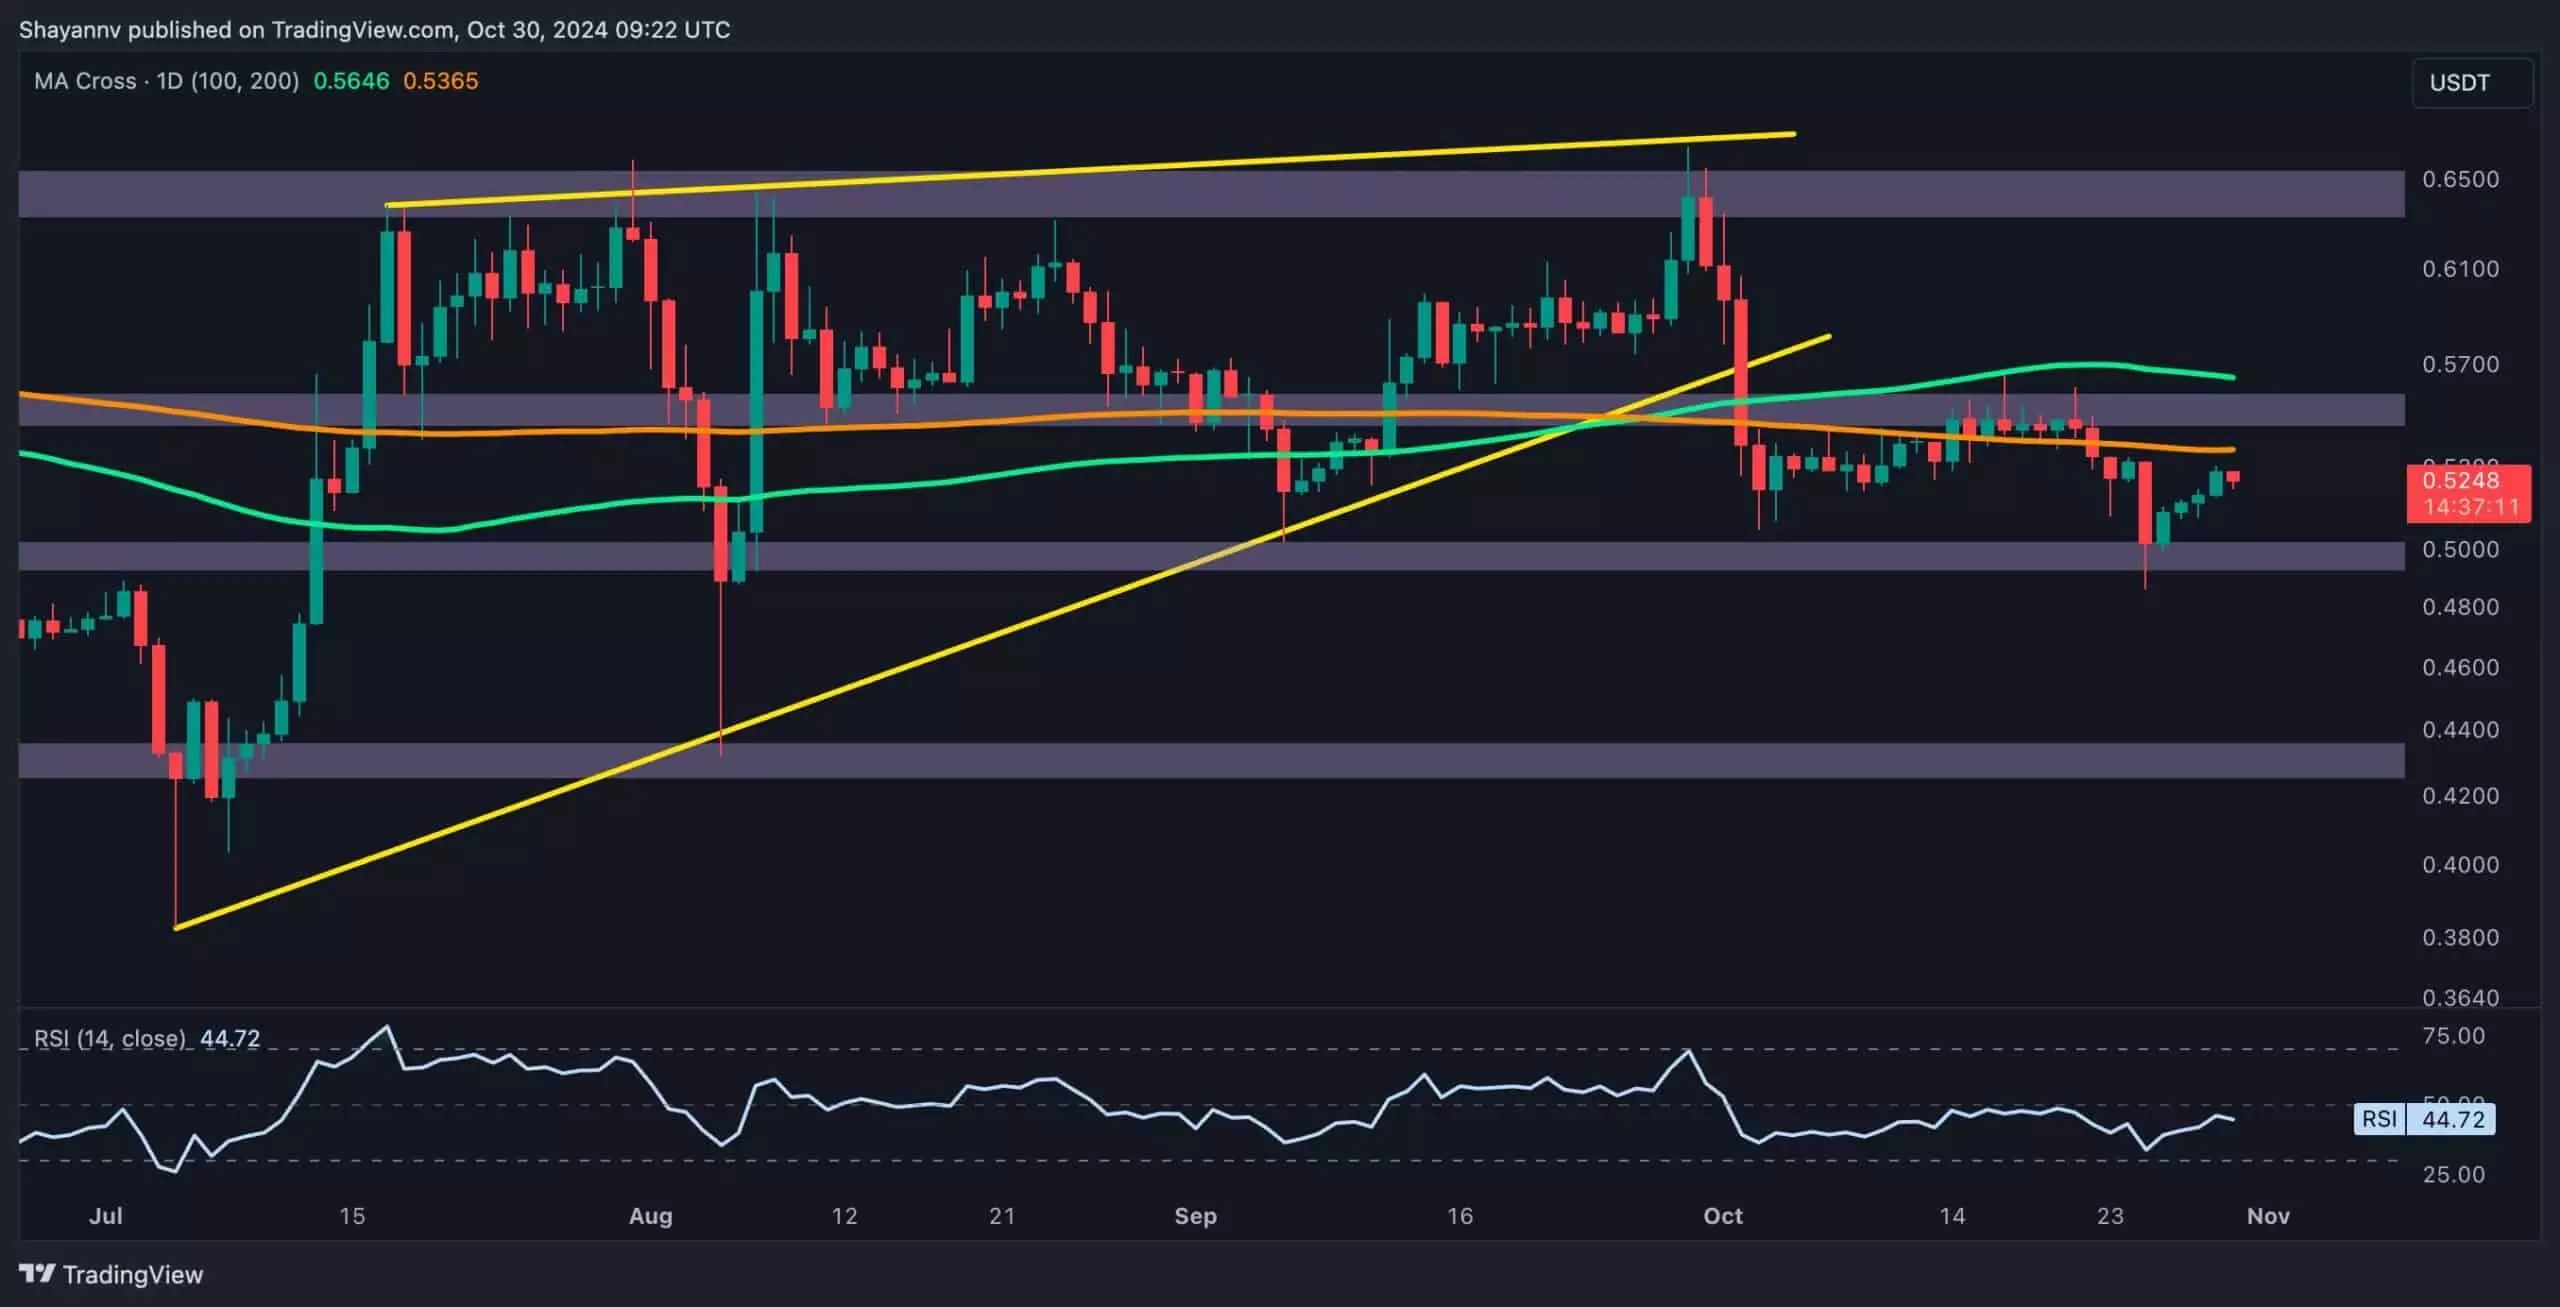
Ripple (XRP) has recently exhibited a complex interplay of market dynamics that reflect hesitancy among traders and investors. Following a brief uptick from the significant support level around $0.5, XRP has encountered considerable resistance at the 200-day moving average, currently positioned at approximately $0.57. This pivotal threshold has historically been a crucial point for Ripple, often delineating bullish momentum from bearish pressure. An inability to maintain levels above this moving average intensifies the caution among market participants, sending signals that a retest of lower levels could be forthcoming.
Resistance and Support: The Market’s Tug-of-War
The daily chart analysis illustrates a narrative of renewed selling activity, with XRP struggling to build on its prior gains. The 200-day moving average serves not only as a technical indicator but also as a psychological barrier for traders. The significant sell-off that followed the rejection at this level underscores the sellers’ resolve to push prices southwards. The support zone near the $0.5 mark has become the battleground where buyers have historically rallied. This zone has proven resilient over the past year, but the pressure is mounting as Ripple now faces the challenge of sustaining itself above this critical defensive line. Should the price falter and break below this support, it opens the gates to further declines that could land Ripple near the $0.46 threshold.
Short-Term Analysis: The Implications of Fibonacci Levels
Zooming into the 4-hour chart, one can observe a descending consolidation pattern that adds another layer of complexity to Ripple’s price movement. The interaction between the supports at the 0.5 ($0.52) and 0.618 ($0.49) Fibonacci retracement levels creates a tight trading range for XRP. This dual support has reinforced the scenario where traders may anticipate stability. Yet, the formation of a descending wedge indicates indecision, with recent buying efforts pushing the price toward the wedge’s upper boundary at approximately $0.53. A breakout beyond this level may hint at a potential bullish resurgence, propelling the price towards the $0.55 resistance.
However, the broader market sentiment leans heavily on the side of caution. Challenges in overcoming the aforementioned resistance levels may lead to a continuation of the downward trend, compelling XRP to revisit the $0.5 support. Crypto markets are often influenced by external factors such as regulatory news and macroeconomic indicators, which means that Ripple’s price trajectory remains highly susceptible to shifts in trader sentiment.
Ripple’s current price action illustrates a market grappling with uncertainty and mixed signals. While the memory of previous support levels offers hope for a recovery, the prevailing resistance at critical moving averages poses significant barriers. Investors must tread carefully, weighing the potential for bullish trends against the risks of further declines. As Ripple continues to navigate these turbulent waters, the interplay between support and resistance will define its short-term trajectory, leaving traders contemplating the next moves in this ever-evolving landscape.

